As sure as night becomes day, there will be a time when the daily news will not be about COVID cases nor US politics or Brexit. We will continue to bring you shares that will benefit in this future environment under the “Lockdown Series”, however, post lockdown we believe we could be at the start of a regime change and new market chapter that is more akin to pre Naughties. Something which many investors are not ready or conditioned for.
The announcement of vaccine news in November gave the market a significant jolt and something we wrote about on 29th October. Yes, the S&P went up 10% for the month which is significant. However, for those of us that like market stats and history, over the last 20 to 30 years members of The Collective have seen monthly returns of this magnitude 4 or 5 times.
What was extremely unique and unheard of, and many people will have missed, is that beneath the surface stocks like Exxon, Royal Dutch Shell and British Petroleum went up 30% or more. That is incredible. This is small cap, biotech and mining stock type volatility on mega cap companies.
These sort of moves can only happen with extreme positioning in the market. Within the Dow Jones index, Chevron went up 32% in November (this has happened one other month in 50 years) and Apple and Microsoft were flat.
This is a sign of significant change. To put some further historical context around the importance of November 2020:
- Value stock (more to follow) started the month at, some believe, 200 year lows relative to growth stocks. Some fascinating market history here (https://www.twocenturies.com/blog/2020/5/4/value-crashes-deep-history)
- While gold has gone up 60% in 2019 and 2020, between 1975 and 1979 gold increased by 600%.
- The World Metals & Mining Index is at 25 year lows relative to the Dow Jones.
- The concentration of Tech stocks within the S&P 500 is as high as 1999.
- The increase in money supply and government bank stimulus reached new extremes.
What next for investors over coming years? Welcome to the “Inflation Series”.
5 themes that will feature in this series
To ensure that our readers have inflation protection, we are going to discuss investments under 5 different headings. There will be an extensive number of opportunities.
- Gold and precious metals – this can involve direct allocation and mining related plays. More to follow.
- Commodity and energy related investments – deeply out of favour in an environmentally focused world.
- Real asset exposure – we will consider real assets that serve as inflation hedges and income streams that are inflation linked.
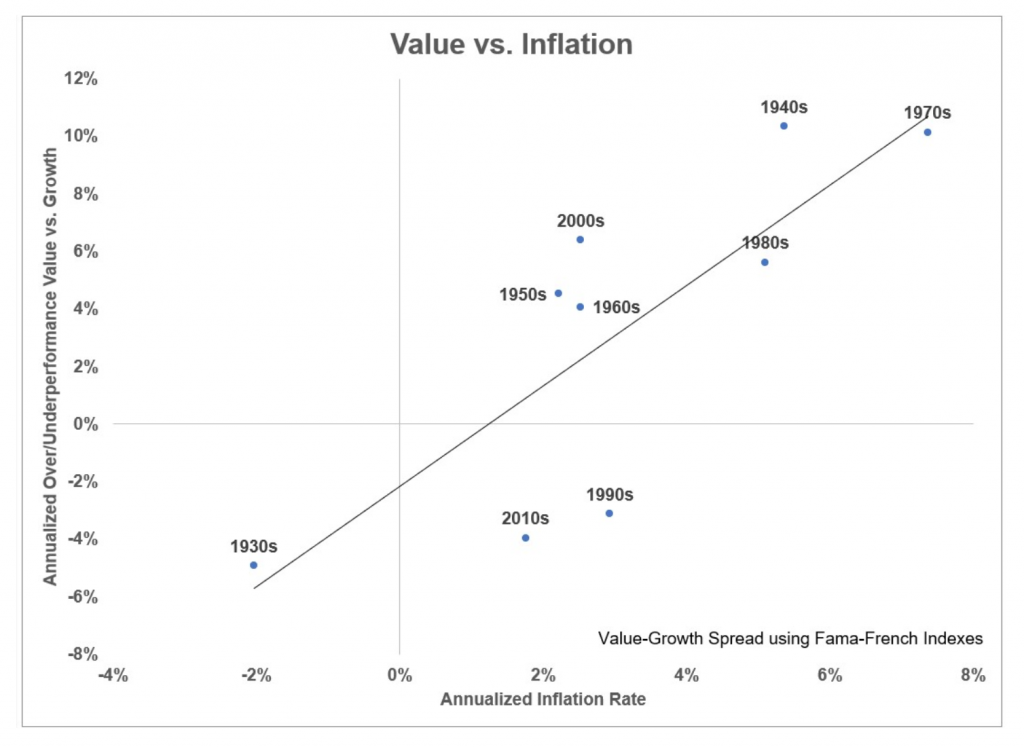
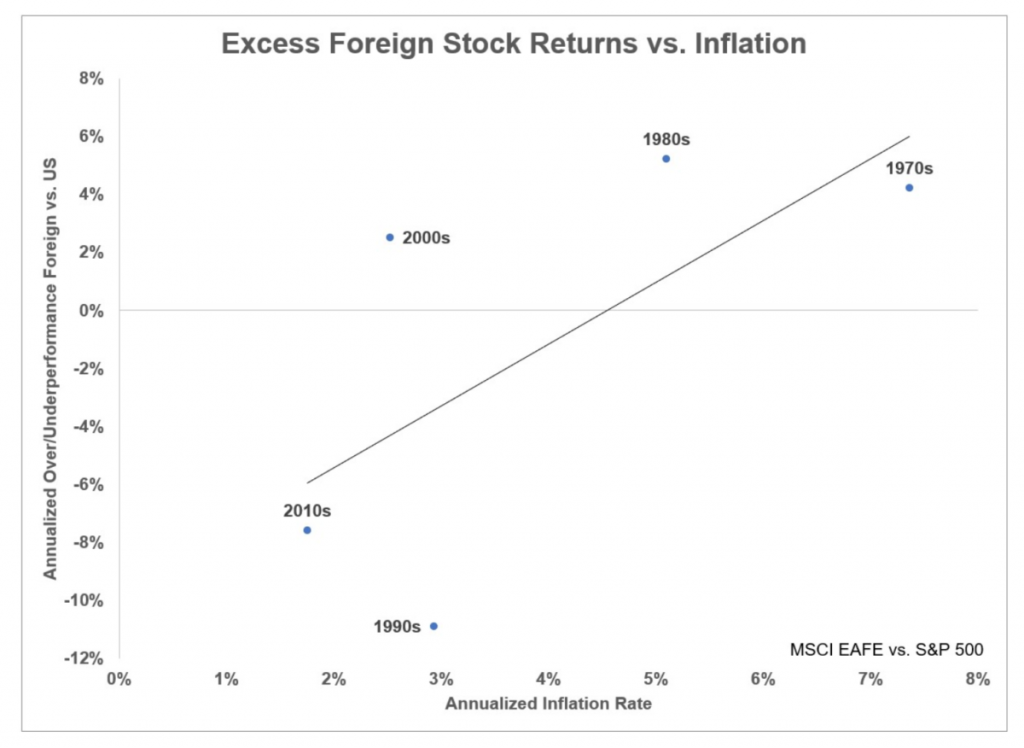
- Value stocks, dividend growth and non-US allocations – before the Naughties, with higher inflation and higher GDP growth, you needed to own value stocks, high and growing div yield and non-US allocations. We will revisit.
- Collectibles and digital currencies – we will explore the new paradigm of digital currencies and have fun flagging some collectible/scarce assets.
Background – Central Banks, Money Supply, Fiscal Stimulus and Velocity of Money
Let us start by discussing the most important aspect of capital markets and global asset prices – the role of Central Banks. This has never been greater and is well documented. 4 quick charts as a reminder of where we are:
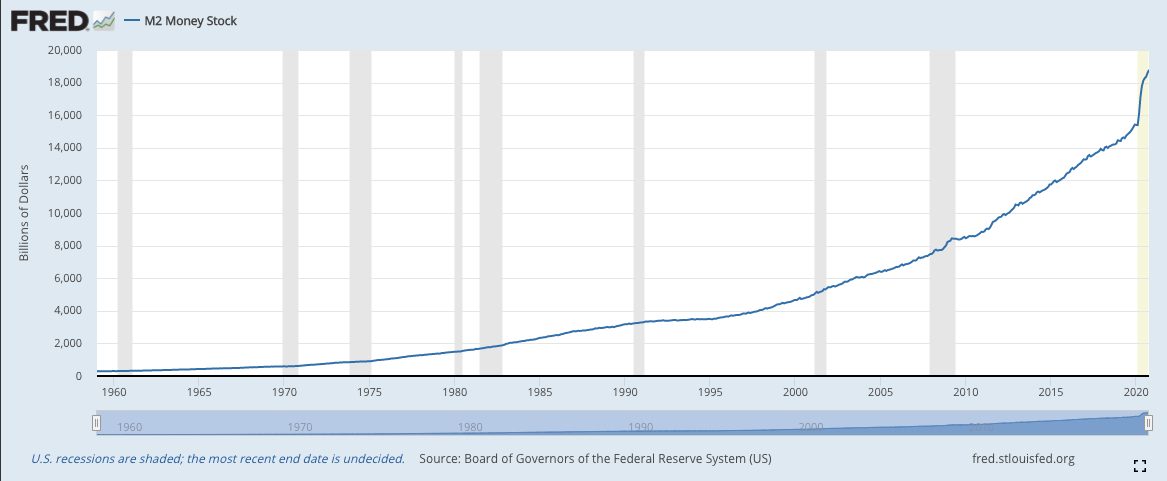
1) US money supply
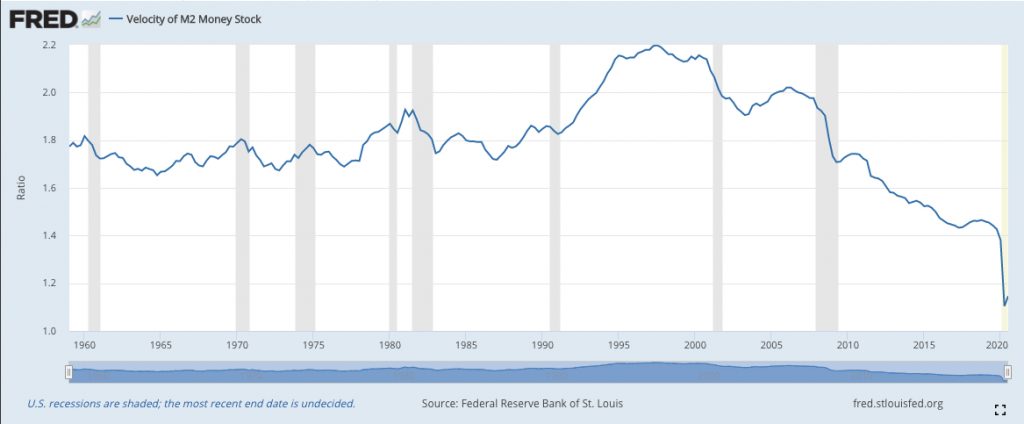
2) US velocity of money
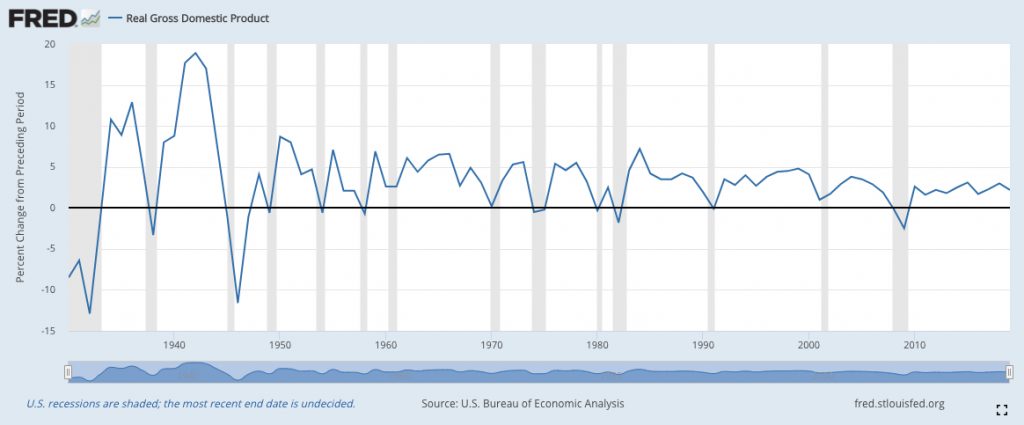
3) US GDP growth
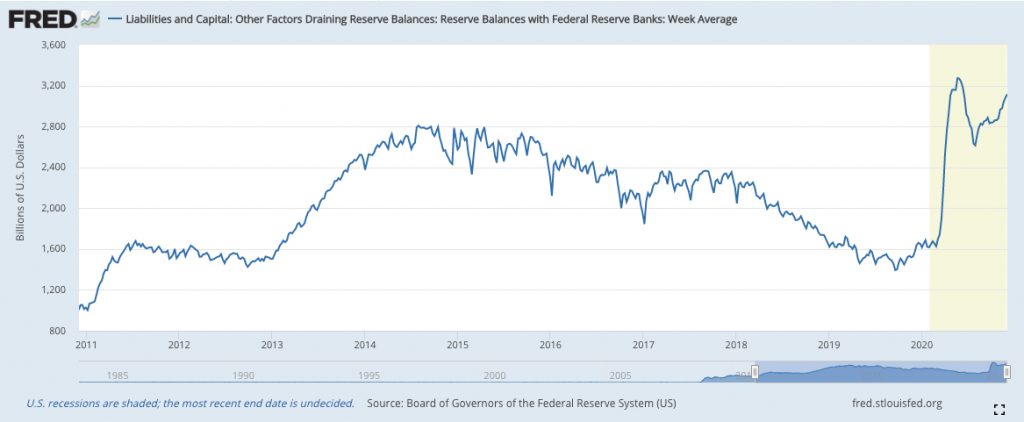
4) Reserves at banks (hoarding of money).
We will keep this simple, as it would possible to debate supply side economics and Friedman versus Keynesian theories extensively.
In the last 12 years, the Federal Reserve (and other central banks) have delivered a rapid increase in the money supply (Chart 1). This was done to avoid a deflationary bust like the US experienced in the 1930’s. This increase in the money supply has accelerated significantly this year with the global slump due to the COVID related crisis and economic lockdown.
It’s important to understand how all this works. The Federal Reserve will buy government securities from a normal bank. That bank in turn, with the proceeds, will now lend money against the proceeds. The Fed’s ability to do this is almost unlimited as it can create dollars (digitally) to purchase securities it issues – the only risk would be if there was a loss of confidence in the US dollar. To date this has not happened.
But isn’t all this increase in money not going to lead to inflation? To date this has not been a factor. Why not? We have hoarded money rather than spend. This year , when the crisis exploded, reserve balances escalated significantly. Velocity of money has been low and this has meant no inflationary pressure. Let us look at a simple working of velocity:
“Consider an economy consisting of two individuals, A and B, who have $100 each. A buys a car from B for $100. Then B purchases a home from A for $100. B has kids and enlists A’s help in adding new construction to his home. For his efforts, B pays A $100. A also sells a car he owns to B for $100. Thus, both parties in the economy have made transactions worth $400, even though they only possessed $100 each.
In this economy, the velocity of money would be two resulting from the $400 in transactions divided by the $200 in money supply. This multiplication in the value of goods and services exchanged is made possible through the velocity of money in an economy”
Source: Investopedia
What does all this mean? We have been in a low growth environment (Chart 4) with a low velocity of money in the economy. The dollars created by the Federal Reserve have not found there way into the “transaction economy” but instead have found there way into cash, bonds and property – but not velocity. In the 1960’s, 1970’s, 1980’s and 1990’s the velocity of money (GDP / M2 ) had a ratio normally around 1.8 to 2. This is now collapsed to 1.1 i.e. Money supply is increasing more than general economic activity = less inflationary pressure.
How are governments going to get economic activity higher? Get ready for the demand side and fiscal stimulus.
Fiscal Stimulus Is The Greatest We Have Seen Since WWII
If money supply is providing money to the banks to lend, fiscal stimulus is providing money to people to spend. Both are required if the government is to support economic growth. The amount of fiscal stimulus is incredible – and we believe this will find its way into the real economy and spending and inflation will follow in due course.
The announced stimulus packages in 2020 in the US are forecasted to add $3.3 trillion to the 2020 fiscal deficit. Fiscal stimulus of this magnitude has not been seen since World War II. Was it enough? Reported GDP for the second quarter saw personal income increase 7% versus Q1. This was the biggest increase in history! However, if you back out the contribution of government transfers to income, then income fell 6% versus Q1, which would be the worst decline in history. So you can see the role that the government played – they flooded people bank accounts with stimulus cheques. Consumer savings meanwhile increased by $3.1 trillion. This shows there was plenty of government handouts to cover the income loss during the shutdown. Where did all the money go? See Chart 5.
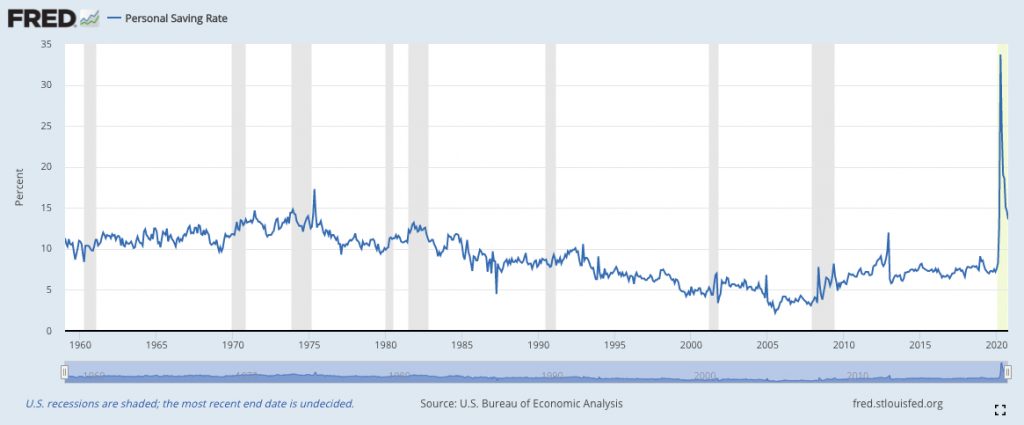
People were locked up at home and nervous so they saved it. A saving rate like we have never seen before in 2020. The personal saving rate (% of personal income saved) in the US spiked in the 1970’s. You had the OPEC crisis in 1973 and the loss of the Vietnam War in 1975. However, from 1975 to 1998 the personal saving rate went from 15% down to 5% and, as shown above, the velocity of money ratio went from 1.7 to 2.2.
Finally, this fiscal response has not just been in the US but global. The EU has suspended all the rules around state aid and fiscal spending (how different to 2008 conditionality of bailouts and the austerity era) and the gloves have truly come off : https://www.bruegel.org/publications/datasets/covid-national-dataset/
To put some historical context around this, the Marshall Plan post the second World War was worth $135bn in modern day money. Those transfers happened between 1948 to 1952 as an effort by the US to help Europe recover and protect the West from Communism. The Sustainable European Investment Plan is worth over €1 trillion and will be invested over 10 years. However, the plan delayed with COVID in 2020. These government program will all come back online – and they will involve building, infrastructure and project spend. Something that is very resource and commodity intensive.
Historically You Owned Value And Non-US Stocks In Times Like These…
Conclusion?
Getting to a simple conclusion – a post lockdown world with a significant monetary and fiscal stimulated GDP growth surprise could mean a higher velocity of money, something none of us have seen for 20 years. Higher velocity of money will mean more inflation.
This could mean investing like in the 1970’s through to the 1990’s. If you bought $100 of Gold and $100 of US Dow Jones stock in 1970, it was not until 1995 that stocks outperformed in price terms. In addition, per the above charts, you needed to own value stocks and non-US equities. We find ourselves in a scenario where:
- Value stocks are deeply out of favour
- Commodity related stocks have underperformed
- Dividend yields and dividend growth are plentiful
- Non-US stocks have underperformed US stocks
If the top down view is correct, the opportunities are plentiful. We kick off the series with a look at US Oil & Exploration names see our newest post here on the XOP equally weighted ETF
Collective Finance Research
Lot’s more to follow….
The Collective are a panel of stock enthusiasts writing about high conviction investment opportunities with high return potential.
While in general we think that the baseline scenario is a low-inflation environment, there are two important caveats here. First, as pandemic causes dramatic changes in economies structure and agents behavior, the measurement of consumer inflation will be a serious challenge in coming months. Goodhart and Pradhan (2020) state that at a time when the basket of goods and services that we buy has so suddenly been distorted out of all recognition, it will become almost impossible over the next few months to put together sensible and meaningful data for CPI, RPI, or any other inflation series . That may distort significantly both the inflation statistics published by national statistical offices and authorities reaction to them.